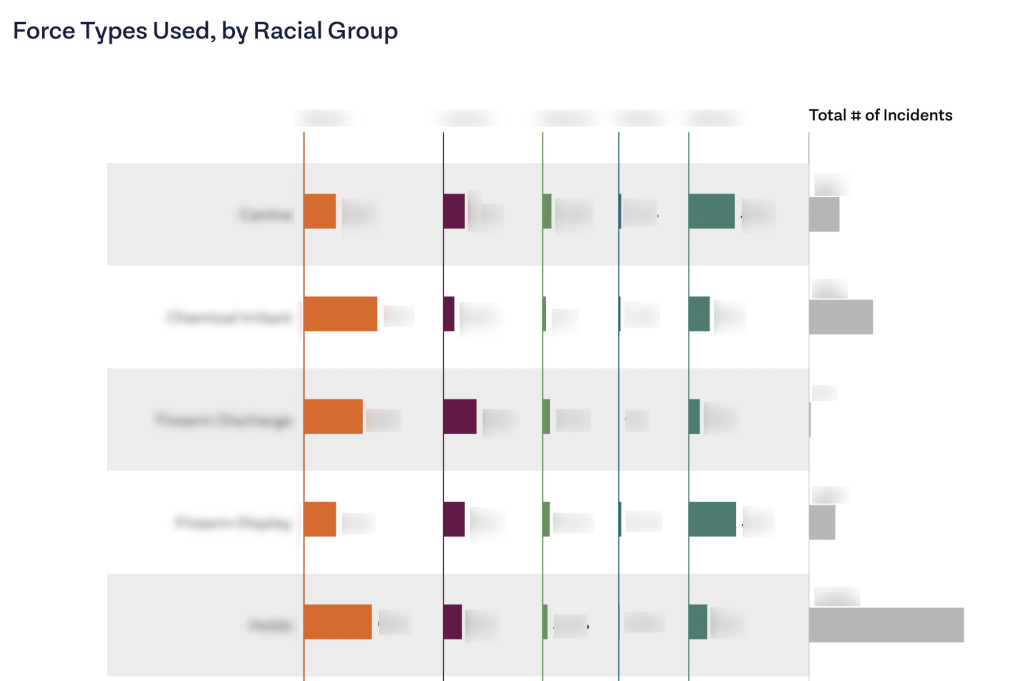
How did deputies use force?
According to Los Angeles County Sheriff’s Department West Hollywood Station data:
What should be investigated further?
Racial disparities in recorded uses of force are apparent across most types of force. The 2 most common force types recorded overall were “Holds” and “Takedown.”
How can departments reduce disparities in use of force?
Explore Related Insights

Which people did deputies stop and search?
51% of all people stopped between 2018 and 2021 were White.
20% of all people stopped between 2018 and 2021 were Latinx.
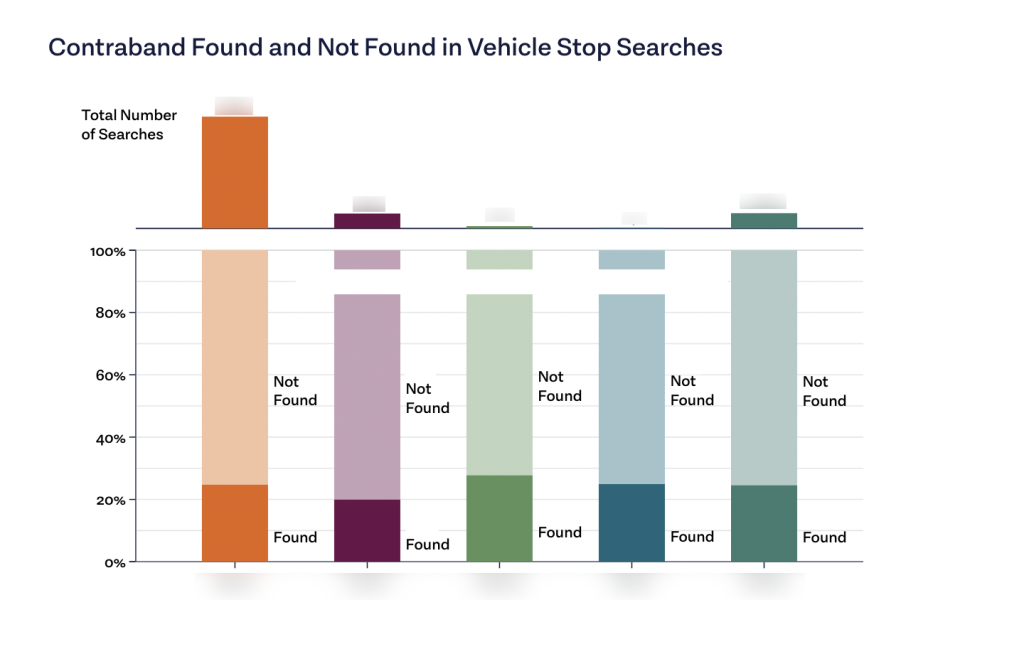
Which people did deputies search at stops?
At traffic stops, deputies searched Black people 5 times as often as White people.
Deputies searched 122 Black people who did not have any contraband, compared to 71 White people.
How can departments reduce disparities in traffic stops?
Explore Related Insights
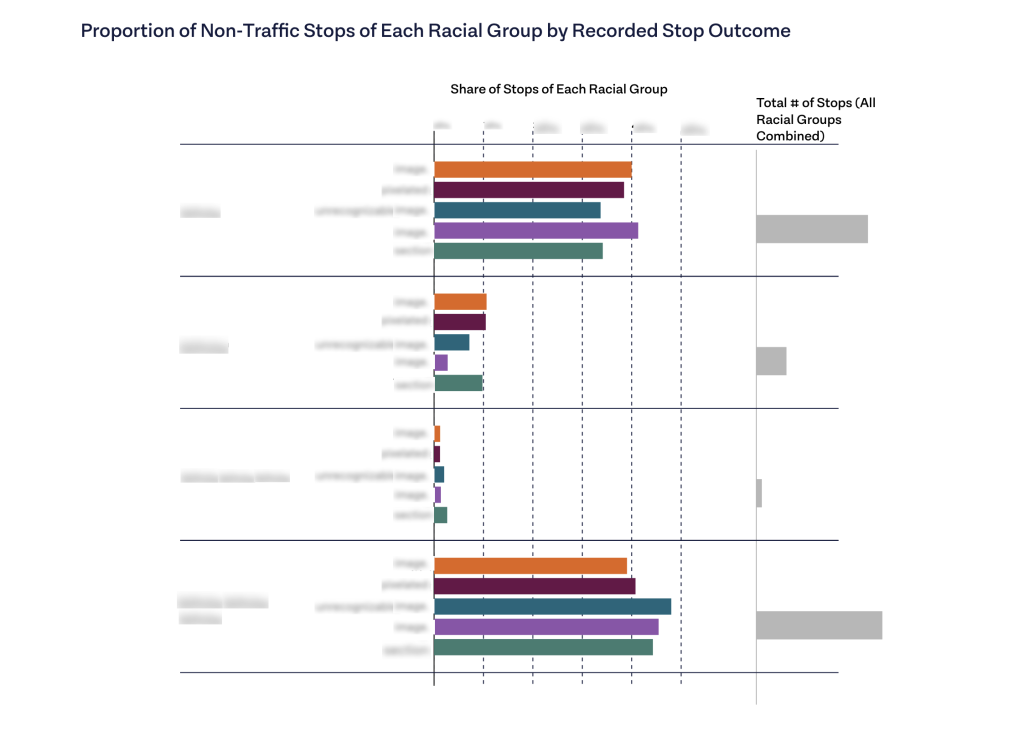
Which people did deputies stop?
According to Los Angeles County Sheriff’s Department West Hollywood Station data:
How can departments reduce disparities in non-traffic stops?
Explore Related Insights

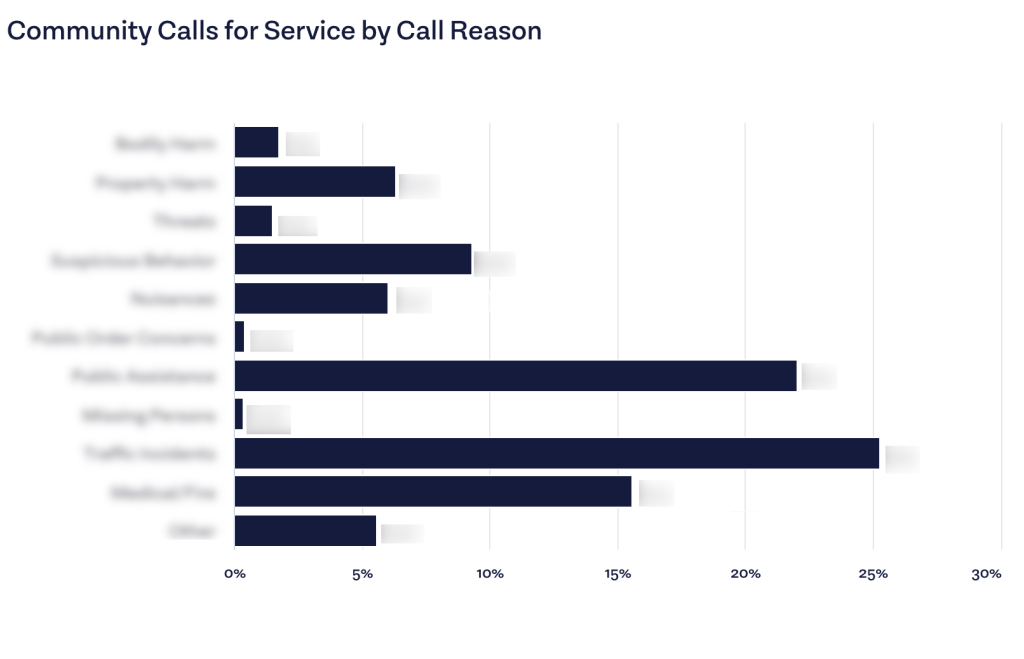
How did deputies spend their time?
13% of these events involved Bodily Harm, Property Harm, or Threats.
All Other Events involved no report of Bodily Harm, Property Harm, or Threats.
What should be investigated further?
13% of these events involved Bodily Harm, Property Harm, or Threats.
How can public safety resources be better aligned with community needs?
Explore Related Insights
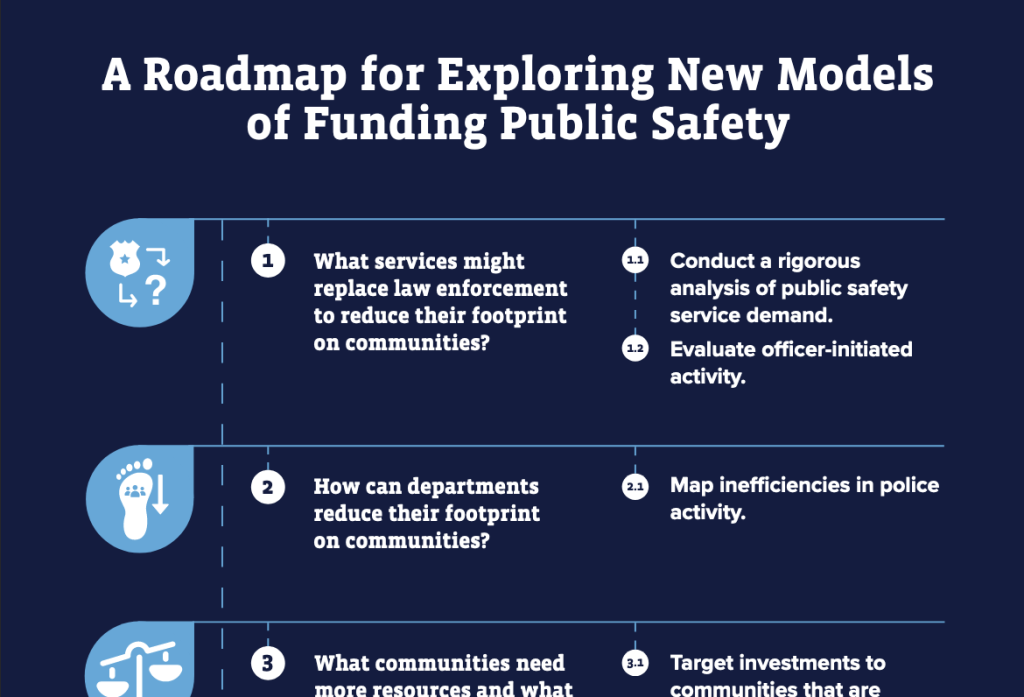

NEXT STEPS TO REDUCE DISPARITIES
How can public safety resources be better aligned with community needs?
OUR METHODOLOGY
CPE’s approach to assessing racial disparities in policing uses population benchmarking combined with other strategies that allow us to perform standardized analyses across law enforcement agencies. Population benchmarking cannot account for out-of-town visitors to the City of West Hollywood, but it can provide meaningful information about the experiences of people interacting with the LASD deputies, even if some or many of the people who are stopped or subjected to force may have come from out of town. Visit the Justice Navigator homepage to learn more about the methodologies we use.
ACKNOWLEDGMENTS
Suggested citation: Center for Policing Equity (2023). West Hollywood, CA. Justice Navigator, justicenavigator.org.
